Science Television
Transition to Chaos:
The Orbit Diagram and the Mandelbrot Set
by Robert L. Devaney
Copywright 1990
Running time 65 min.
Devaney's richly illustrated explanation of chaos theory
featuring the animation A Homoclinic Explosion: Down the
Spine of the Period 3 Mandelbulb.
This video will soon be available as a DVD from CustomFlix of
Amazon.com
Description
In this video-lecture Prof. Robert L. Devaney explores and
explains two of the more fascinating images that arise in the
study of Dynamical Systems, namely the orbit (or bifurcation)
diagram and the Mandelbrot Set. Both of these images arise
when a quadratic function is iterated, so the level of
mathematical sophistication necessary to understand the
lecture is minimal. The main goal of the lecture is to describe
the relationship between these two images, how they are
generated as well as what they mean mathematically.Several
important related concepts in dynamical systems theory are
also described, including period doubling bifurcations,
Feigenbaum's number, Sarkovskii's Theorem and the role of
critical orbits.
The mathematical concepts are illustrated with colorful slides,
films and computer experiments done in real time.
Reviews
The College Mathematics Journal, November 1991
This is a three-part videotape. Each runs for about 20 minutes.
Part 1 deals with iteration of the quadratic function x squared
plus c for different values of the parameter c. As c varies from
0.5 to -2, we see the resulting orbits converging to a single
fixed point, then to a period 2 orbit, then to a period 4 orbit,
and so on until it becomes a completely chaotic orbit. The
results are then redone using a standard graphical analysis.
Part 2 generates a plot of the asymptotic orbit diagram for the
same range of c values. The viewer sees the graph starting as
a small line segment that repeatedly bifurcates into 2 small
line segments until eventually the chaotic regime appears.
Devaney covers these pitchfork bifurcations in some detail. The
viewer is shown the period 3 window inside the chaotic region. A
rough value of Feigenbaum's constant is derived on an
empirical basis. Sarkowskii's theorem also is formulated and
explained.
Part 3 deals with iteration of the complex function z squared
plus c. The Mandelbrot set is plotted and the camera zooms in
on different parts, showing beautiful enlarged versions which
sometimes include another copy of the Mandelbrot set. Also
shown are filled in Julia sets for different points in the
Mandelbrot set and nearby.
It is important to note that the only chaos referred to in this
videotape is that which develops when quadratic functions are
iterated. There is now reference to strange attractors or to other
more sophisticated forms of chaos. These omissions no doubt
were caused by the need to limit what can be presented in an
hour. On the plus side, the treatment is relatively simple and
easy to follow - even for an interested high school student.
A high point of the tape is the simultaneous presentation of
the Mandelbrot set and the orbit diagram on the same screen.
The viewer is able to relate the bifurcation points and windows
of the orbit diagram to different segments of the Mandelbrot
set. Another high point of the tape is the cinematographic
presentation of the Julia sets of a point that keeps moving in
and out of the Mandelbrot set. When the moving point is inside
the Mandelbrot set, the Julia set is connected; when the
moving point is outside the Mandelbrot set, the Julia set is
totally disconnected - Cantor dust. Thus the presentation keeps
changing from one pretty pattern to another and occasionally
explodes into Cantor dust and then recondenses into a
connected piece. The effect is extremely pleasing to the eye
and can entice the viewer into the study of fractals and
dynamical systems.
This videotape demonstrates that with the right effort, even the
most sophisticated ideas on the frontiers of contemporary
research in a new field can be made both transparent and
beautiful.
Kathirgama Nathan, LaGuardia Community College, CUNY
The Orbit Diagram and the Mandelbrot Set
by Robert L. Devaney
Copywright 1990
Running time 65 min.
Devaney's richly illustrated explanation of chaos theory
featuring the animation A Homoclinic Explosion: Down the
Spine of the Period 3 Mandelbulb.
This video will soon be available as a DVD from CustomFlix of
Amazon.com
Description
In this video-lecture Prof. Robert L. Devaney explores and
explains two of the more fascinating images that arise in the
study of Dynamical Systems, namely the orbit (or bifurcation)
diagram and the Mandelbrot Set. Both of these images arise
when a quadratic function is iterated, so the level of
mathematical sophistication necessary to understand the
lecture is minimal. The main goal of the lecture is to describe
the relationship between these two images, how they are
generated as well as what they mean mathematically.Several
important related concepts in dynamical systems theory are
also described, including period doubling bifurcations,
Feigenbaum's number, Sarkovskii's Theorem and the role of
critical orbits.
The mathematical concepts are illustrated with colorful slides,
films and computer experiments done in real time.
Reviews
The College Mathematics Journal, November 1991
This is a three-part videotape. Each runs for about 20 minutes.
Part 1 deals with iteration of the quadratic function x squared
plus c for different values of the parameter c. As c varies from
0.5 to -2, we see the resulting orbits converging to a single
fixed point, then to a period 2 orbit, then to a period 4 orbit,
and so on until it becomes a completely chaotic orbit. The
results are then redone using a standard graphical analysis.
Part 2 generates a plot of the asymptotic orbit diagram for the
same range of c values. The viewer sees the graph starting as
a small line segment that repeatedly bifurcates into 2 small
line segments until eventually the chaotic regime appears.
Devaney covers these pitchfork bifurcations in some detail. The
viewer is shown the period 3 window inside the chaotic region. A
rough value of Feigenbaum's constant is derived on an
empirical basis. Sarkowskii's theorem also is formulated and
explained.
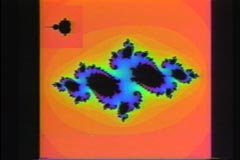
Part 3 deals with iteration of the complex function z squared
plus c. The Mandelbrot set is plotted and the camera zooms in
on different parts, showing beautiful enlarged versions which
sometimes include another copy of the Mandelbrot set. Also
shown are filled in Julia sets for different points in the
Mandelbrot set and nearby.
It is important to note that the only chaos referred to in this
videotape is that which develops when quadratic functions are
iterated. There is now reference to strange attractors or to other
more sophisticated forms of chaos. These omissions no doubt
were caused by the need to limit what can be presented in an
hour. On the plus side, the treatment is relatively simple and
easy to follow - even for an interested high school student.
A high point of the tape is the simultaneous presentation of
the Mandelbrot set and the orbit diagram on the same screen.
The viewer is able to relate the bifurcation points and windows
of the orbit diagram to different segments of the Mandelbrot
set. Another high point of the tape is the cinematographic
presentation of the Julia sets of a point that keeps moving in
and out of the Mandelbrot set. When the moving point is inside
the Mandelbrot set, the Julia set is connected; when the
moving point is outside the Mandelbrot set, the Julia set is
totally disconnected - Cantor dust. Thus the presentation keeps
changing from one pretty pattern to another and occasionally
explodes into Cantor dust and then recondenses into a
connected piece. The effect is extremely pleasing to the eye
and can entice the viewer into the study of fractals and
dynamical systems.
This videotape demonstrates that with the right effort, even the
most sophisticated ideas on the frontiers of contemporary
research in a new field can be made both transparent and
beautiful.
Kathirgama Nathan, LaGuardia Community College, CUNY
| |
| |
| |
| |
| |